


Imagine you’ve built a new and innovative product. This time you did it right: before you started developing anything, you got out of the building and spoke with customers. You really understood their pain points and validated your assumptions. You built an MVP based on your findings and it seems to be working out, people are using it. You’ve confirmed that you have identified a problem worth solving and that people are willing to pay for your solution. Now you’re looking to optimize for growth. What should you build next?
Before we can propose changes we will need to understand our current state to identify areas of opportunity.
Starting with high-level metrics
One graph that is commonly used to represent growth on product dashboards is the number of customers. High-level metrics like total customers can be useful for gaining insight into business results like revenue and getting a high-level overview of what is happening with the product, but provide no context into why it is happening and they give no clear next-step or action to be taken in order to improve
Pros
- High-level overview of product performance
- Gain quick insights into business impact such as revenue
Cons
- Hide customer behavior
- Can be interpreted in different ways
- No clear next-step to improve
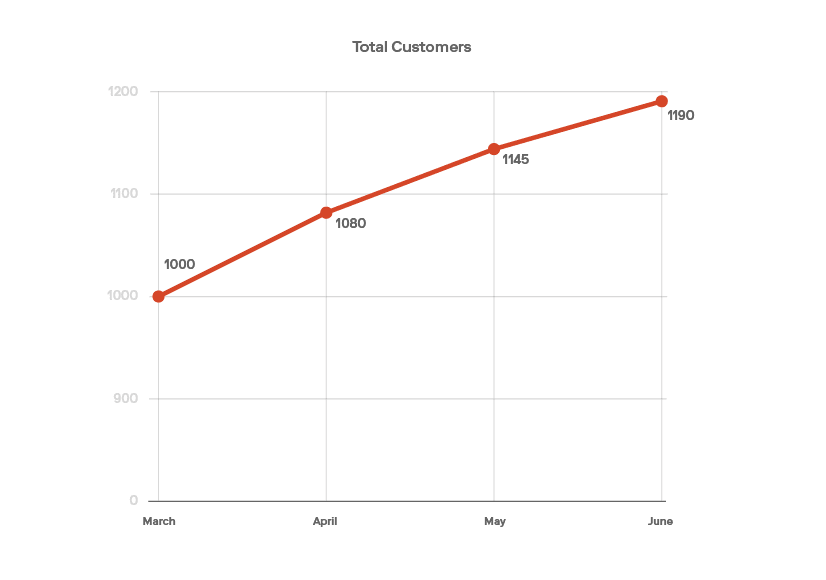
Above we can see that our growth rate has slowed over the past few months. The problem is that we can’t tell why it is slowing. Have we been acquiring fewer customers, losing more customers, or some combination of the two? If we're losing more customers, why are they leaving? The real reasons behind changes to the customer count are open to interpretation at the moment. We need to discover what they are before we can actually know the steps needed to improve.
Incorporating actionable metrics
When is a metric actionable? When there is a clear next step to improve the metric and ultimately drive higher-level business goals. These metrics are useful for more precise health checks and help measure progress towards a specific goal. Having that next clear step will help to drive alignment among stakeholders.
Pros
- Include a clear next step
- Make problems visible immediately
- Drive alignment among stakeholders
Cons
- Too granular on their own for overall business performance (how much revenue will we make this year)

Earlier we were inferring growth from the number of customers over time. Here, we dive into what’s happening by breaking growth down into its composite parts: customer acquisition and churn rates. In this example, our churn rate has been slowly growing over time and is approaching our customer acquisition rate. Now we are able to identify what the problem is immediately: we need to reduce churn.
Still unknown to us is the reason why our churn rate is so high. We need to understand why our customers are leaving. Before reaching out to customers for feedback, we could spend some time investigating any possible pain points in their experience using the product. One way to do this is to map out the user journey and measure the user’s progress through that journey in a funnel.
Tracking progress through a journey
A funnel tracks how many users make it through each step of a process, and gets its name from the shape it often takes as fewer customers make it to the end. Funnels are a great way to distill a lot of information into a few numbers and to bring your attention to potential problem areas or opportunities within your product. Funnels help to highlight user actions giving us immediate feedback which can be used as a leading indicator for lagging higher level metrics like churn.
Pros
- Distill information
- Easy to understand
- Reveal potential problem areas
- Leading indicators of higher level metrics
Cons
- Work best with linear flows
- Shows where users are leaving, but not why
To illustrate this, let’s say our innovative product is a web application which allows customers to share their favorite memories with friends by creating interactive online scrapbooks in a simple, convenient way. The process by which new customers experience the product’s core value is as follows:
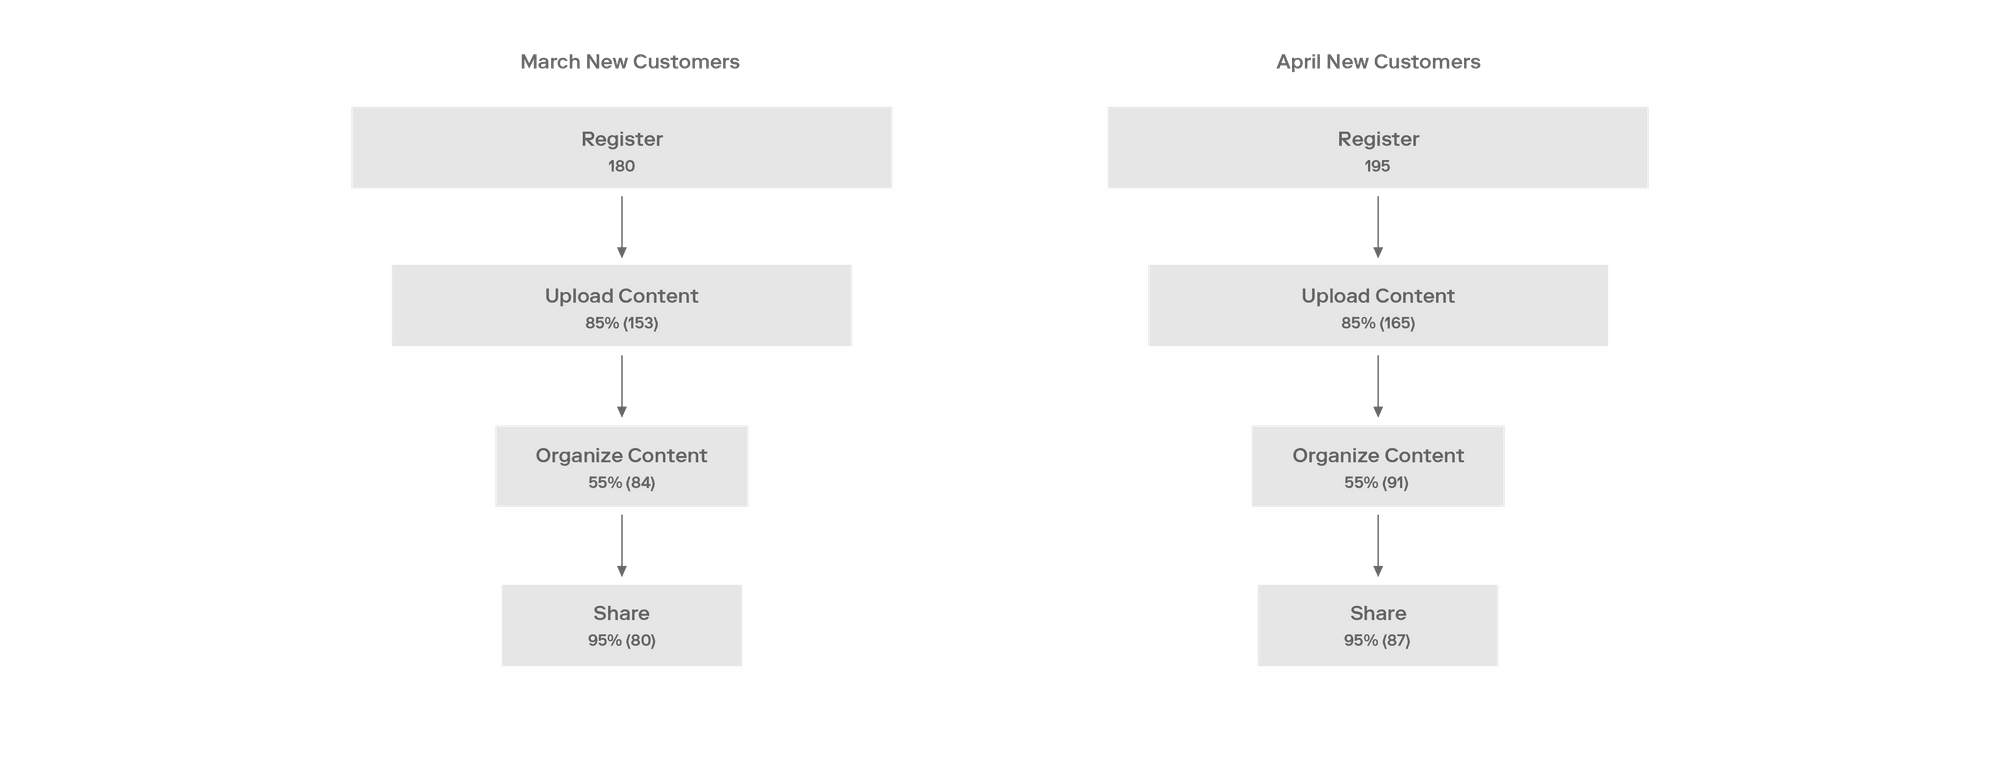
First a user would register and become a customer, then they would upload content for their scrapbook, organize that content and lay out their scrapbook, and finally share it with friends.
Above we can see that 85% of customers proceed to upload their content as the first step of creating a scrapbook, and only half of that 85% are able to organize their content into a scrapbook. We can hypothesize that customers may be running into problems at this step and that this is causing them to leave the product altogether. Now we could perform customer interviews to validate this hypothesis and focus on revealing the challenges customers face when trying to organize their scrapbooks.
Once we have identified the main challenge and implemented a solution, we can continue measuring these funnels to verify if our solution is improving the rate of customers completing that step. If our hypothesis is correct, an improvement here should be reflected in our churn rate, which then should increase our growth rate.
Looking back
When we started out with only 'total customers over time', we could have drawn the conclusion that we needed to focus on acquiring new customers and spent our time building features that we thought would win more sales. Instead, we chose to dig deeper into actionable metrics that are meaningful and learned that churn, not acquisition, is our biggest opportunity. We identified what could be a major roadblock for many users and now have a clear next step: investigate the roadblock and propose a solution. Lastly, we have the metrics to measure the impact of our work as we move forward. Now we're maximizing the return on our development time.
Conclusion: Start with the right questions
Think about the high-level business goals your team is working towards, it may be something like “increase revenue through the product” or “increase engagement with the marketing site".
Ask yourself if the metric associated with this high-level goal is easily understood by all or if it can be interpreted in multiple ways. What counts as engagement - a page view? A button click? Does scrolling count? What about time on page?
Then ask if the metric is actionable - if we implement a layout change to one page and we find that more users click the call to action, do we implement that layout on all pages? What if there is no change in clicks, but more users scroll down the page? If the metric doesn’t spur action, it isn’t actionable.
Whenever possible, measure user behavior in terms of a larger process. Does our new page layout move more users to the next step in their journey? If not, is it still a valuable change?
Want to know more or discuss further? Reach out with all of your product metric questions on Twitter.